The past two presidential elections have seen stagnant trends in Oxford, Lafayette County and Mississippi.
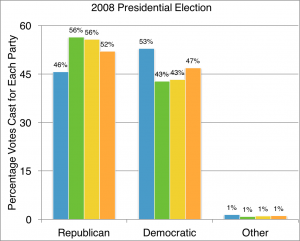
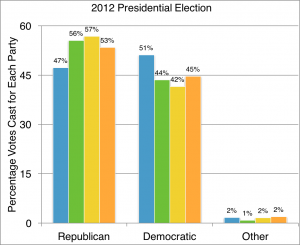
Of the 18,460 votes cast in Lafayette County for the 2008 presidential election, 43.3 percent of people voted for President Barack Obama. The percentage of Democratic votes for the county dropped 1.8 percent in the 2012 election. These numbers were strikingly similar to the entire state of Mississippi where 42.8 percent voted for Obama in 2008 and 43.5 percent voted for him in 2012.
“That surprises me,” said Cristen Hemmins, chair of the Lafayette County Democrats. “Oxford is, from everything I know, very blue, and the county tends to change the demographics and percentages as I understand it.”
The past two presidential elections did not see a drastic change in the election according to the percent of registered votes who cast ballots. The voter turnout had similar trends throughout the 2008 and 2012 elections: Oxford had an 8 percent increase from 11,848 to 12,798, Lafayette County had a 5.7 percent increase from 18,460 to 19,505, the state of Mississippi had a 0.4 percent decrease from 1,218,286 to 1,214,004 and the nation had a 1.8 percent decrease from 131,071,135 to 128,768,072. Hemmins said the Lafayette County Democrats are trying to change that by holding a voter registration drive at a local grocery store every day for the next two weeks.
“I think this is such a controversial presidential election,” Hemmins said. “I think we have a real opportunity as Democrats to reach across the aisle and get some new voters because Trump is such an unset candidate.”
In both 2008 and 2012, the difference between percentage of votes for an individual party for Lafayette County barely varied from the percentage of votes for the same party on the state level. In fact, the widest difference between Lafayette County and the state for both elections was a 2 percent decrease in 2012 for the Democratic Party. Mississippi voted 43.5 percent Democratic in 2012, and that same year Lafayette voted 41.5% Democratic.
“A lot of people have said that this is an election that can really go blue for Mississippi, shocking as that may be,” Hemmins said. “We’re trying to make sure we get out our Democratic vote. That’s where statewide we have a failure.”
Since the 2004 presidential election, Mississippi has voted 3.5 percent more democratic. However, Lafayette County dropped 1.8 percent from 43.3 percent in 2008 to 41.5 percent in 2012. The Libertarian Party rose 0.8 percent between the 2008 and 2012 elections, and the Republican Party rose 1.1 percent during the same timeframe.
Both Lafayette County and Mississippi did not vary much between the 2008 and 2012 presidential elections. Oxford voted for 1.4 percent more Republican and voted 2.3 percent less Democratic from 2008 to 2012.
“I think party is going to play less of a role in this election,” said Dr. Robert Brown, a political science professor at the University of Mississippi. “I think you’ll probably see a little more party defection in both parties this year since both candidates are being viewed so poorly.”
While it is uncommon for a city to reflect a county and for that county to reflect the state, Brown said this could be explained if Oxford’s demographic makeup reflects the same makeup for the county and state. However, he also mentioned that this could be a statistical anomaly.
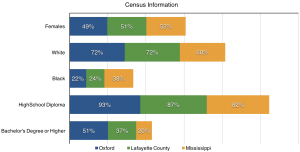
According to the U.S. Census Bureau, Oxford’s demographics are very similar to Lafayette County’s. Mississippi as a whole contrasts of these demographics, such as age, race, gender and ethnicity.
The state is far more racially diverse and impoverished than Oxford and Lafayette County. According to the U.S. Census Bureau, Mississippi is 37.6 percent African-American. Both Lafayette County and Oxford are below 30 percent African-American. Lafayette is 23.9, and Oxford is 21.8. Oxford and Lafayette both have higher per capita income than the state average of $20,956. Oxford has a median of $22,025, and Lafayette has a median of $21,838.
“When I looked at my voters,” Hemmins said speaking of her candidacy for Mississippi State Senate as a Democrat last year, “my support was really strong here in Oxford, but, in the county and the rural areas, you find they are much more conservative and much more republican.”
Three Lafayette County precincts, Abbeville, Oxford 3 and Taylor 3, overwhelmingly voted for the Democratic Party in 2008. They also voted strongly Democratic in the 2012 election. According to Hemmins, these three precincts are Democratic strongholds in the county.
“Seeing Lafayette County vote for a Democrat for the presidential elections would be a great change,” Hemmins said. “It still blows my mind, though. I feel like we are a blue dot in a sea of red. It never ceases to surprise me that we’re not really.”
While many of the statistics were similar between 2008 and 2012, Hemmins said she is optimistic for change in the 2016 Presidential Election.
“Just talking to people, I know lots of Democrats that are really fired up about supporting Hillary,” Hemmins said. “I think that the enthusiasm for her added to the horror over considering Donald Trump being our representative for our country could make the difference this time around.”
The information in this article is from the Lafayette County Circuit Clerk Baretta Mosely, The New York Times and the
U.S. Census Bureau. 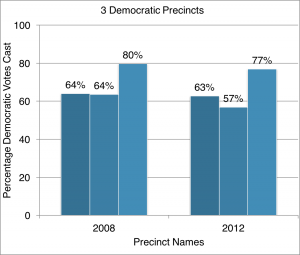
John Cooper Lawton